PHYSICAL SCIENCES
Type of resources
Keywords
Publication year
Topics
-
The magnetotelluric (MT) method is increasingly being applied to map tectonic architecture and mineral systems. Under the Exploring for the Future (EFTF) program, Geoscience Australia has invested significantly in the collection of new MT data. The science outputs from these data are underpinned by an open-source data analysis and visualisation software package called MTPy. MTPy started at the University of Adelaide as a means to share academic code among the MT community. Under EFTF, we have applied software engineering best practices to the code base, including adding automated documentation and unit testing, code refactoring, workshop tutorial materials and detailed installation instructions. New functionality has been developed, targeted to support EFTF-related products, and includes data analysis and visualisation. Significant development has focused on modules to work with 3D MT inversions, including capability to export to commonly used software such as Gocad and ArcGIS. This export capability has been particularly important in supporting integration of resistivity models with other EFTF datasets. The increased functionality, and improvements to code quality and usability, have directly supported the EFTF program and assisted with uptake of MTPy among the international MT community. <b>Citation:</b> Kirkby, A.L., Zhang, F., Peacock, J., Hassan, R. and Duan, J., 2020. Development of the open-source MTPy package for magnetotelluric data analysis and visualisation. In: Czarnota, K., Roach, I., Abbott, S., Haynes, M., Kositcin, N., Ray, A. and Slatter, E. (eds.) Exploring for the Future: Extended Abstracts, Geoscience Australia, Canberra, 1–4.
-

Many scientific talks by Geoscience Australia staff are published on YouTube. These documents provide summaries (‘crib sheets’) of the presentations along with easy access links to each part of the video. They are intended to help teachers of Year 11/12 classes learning about natural hazards
-
This data release presents regional scale groundwater contours developed for the Upper Burdekin Groundwater Project in North Queensland, conducted as part of Exploring for the Future (EFTF), an Australian Government funded geoscience data and information acquisition program. The four-year (2016-20) program focused on better understanding the potential mineral, energy and groundwater resources in northern Australia. The Upper Burdekin Groundwater Project is a collaborative study between Geoscience Australia and the Queensland Government. It focuses on basalt groundwater resources in two geographically separate areas: the Nulla Basalt Province (NBP) in the south and the McBride Basalt Province (MBP) in the north. This data release includes separate, regional-scale groundwater contour datasets for the Nulla and McBride basalt provinces developed by Geoscience Australia in: Cook, S. B. & Ransley, T. R., 2020. Exploring for the Future—Groundwater level interpretations for the McBride and Nulla basalt provinces: Upper Burdekin region, North Queensland. Geoscience Australia, Canberra, https://pid.geoscience.gov.au/dataset/ga/135439. As detailed in that document, the groundwater contours were drawn by hand based on: - Groundwater levels from monitoring bores measured mostly on 17 February 2019 following extensive rainfall. - Surface topography. - Surface water features (rivers and springs). - Remote sensing data. The inferred groundwater contours were used in various Upper Burdekin Groundwater Project components to frame hydrogeological discussions. It is important to note that they were drawn following a wet period; groundwater contours are temporally variable and those presented in this data release therefore only represent part of the regional groundwater flow system.
-
As part of the Great Artesian Basin (GAB) Project a pilot study was conducted in the northern Surat Basin, Queensland, to test the ability of existing and new geoscientific data and technologies to further improve our understanding of hydrogeological systems within the GAB, in order to support responsible management of basin water resources. This report presents selected examples from the preliminary interpretation of modelled airborne electromagnetic (AEM) data acquired as part of this pilot study. The examples are selected to highlight key observations from the AEM with potential relevance to groundwater recharge and connectivity. Previous investigations in the northern Surat Basin have suggested that diffuse groundwater recharge rates are generally low (in the order of only a few millimetres per year) across large areas of the GAB intake beds—outcropping geological units which represent a pathway for rainfall to enter the aquifers—and that, within key aquifer units, recharge rates and volumes can be heterogeneous. Spatial variability in AEM conductivity responses is identified across different parts of the northern Surat Basin, including within the key Hutton Sandstone aquifer. Consistent with findings from other studies, this variability is interpreted as potential lithological heterogeneity, which may contribute to reduced volumes of groundwater entering the deeper aquifer. The influence of geological structure on aquifer geometry is also examined. Larger structural zones are seen to influence both pre- and post-depositional architecture, including the presence, thickness and dip of hydrogeological units (or parts thereof). Folds and faults within the Surat Basin sequences are, in places, seen as potential groundwater divides which may contribute to compartmentalisation of aquifers. Discrete faults have the potential to influence inter-aquifer connectivity. The examples presented here demonstrate the utility of AEM models, in conjunction with other appropriate geophysical and geological data, for characterising potential recharge areas and pathways within the main GAB aquifer units, by helping to better define aquifer geometry, lithological heterogeneity and possible structural controls. Such assessments have the potential to further improve our understanding of groundwater recharge and flow path variability at local to regional scales. Acquisition of broader AEM data coverage across groundwater recharge areas, along with complementary geophysical, geological and hydrogeological data, would further assist in quantifying recharge variability, facilitating revised water balance estimates for the basin and thereby supporting GAB water resource management and policy decision-making.
-
Knowledge of the nature of buildings within CBD areas is fundamental to a broad range of decision making processes, including planning, emergency management and the mitigation of the impact of natural hazards. To support these activities, Geoscience Australia has developed a building information system called the National Exposure Information System (NEXIS) which provides information on buildings across Australia. Most of the building level information in NEXIS is statistically derived, but efforts are being made to include more detailed information on the nature of individual buildings, particularly in CBD areas. This is being achieved in Brisbane through field survey work.
-
Presentation to Australian Research Council (ARC) Training Centre for Data Analytics in Resources and Environment (DARE) Symposium (17 February 2023, University of Sydney) demonstrating use of uncertainty in hydrogeophysical applications as part of the Upper Darling River Floodplain EFTF project.
-
This context report is for the Upper Darling River Floodplain module, which represents the easternmost ‘arm’ of the Exploring for the Future Darling-Curnamona-Delamerian project area within New South Wales. The document provides a summarised state of knowledge regarding the geography, geology, hydrology, hydrogeology and water management of the Upper Darling region. It provides baseline information relevant to understanding the regional context of water resources, with relevance to forward planning and prioritisation of further investigations. As such, this report largely represents a collation of existing information (literature review) for the Upper Darling region, with limited new information (e.g., airborne electromagnetic survey results, preliminary review of existing bore data) being presented.
-
The Geological Survey of South Australia (GSSA) designed the Gawler Craton Airborne Survey (GCAS) to provide high resolution magnetic, gamma-ray and elevation data covering the northern portion of the Gawler Craton. In total, 1.66 million line km were planned over an area of 295,000 km2 , covering approximately 30% of the state of South Australia. The survey design of 200 m spaced lines at a ground clearance of 60 m can be compared with the design of existing regional surveys which generally employed 400 m line spacing and a ground clearance of 80 m. The new survey design results in ~2 x the data coverage and ~25% closer to the ground when compared to previous standards for regional surveys in South Australia. Due to the enormous scale of the survey, the data were acquired using four contractors who employed ten systems to fly the sixteen blocks. To standardise the data from the multitude of systems, Geoscience Australia (GA) employed a comprehensive set of technical specifications. As part of these specifications the contractors were required to fly each of the ten systems over a series of test lines termed the “Whyalla Test Lines” (Whyalla). The final GCAS data provide truly impressive high resolution regional scale products. These will allow more detailed geological interpretation of the prospective Gawler Craton. Survey blocks available for download include: Tallaringa North, block 1A Tallaringa South, block 1B Coober Pedy West, block 8A Billa Kalina, block 8B Childara, block 9A Lake Eyre, block 10 The following grids are available in this download: • Laser-derived digital elevation model grids (m). Height relative to the Australian Height Datum. • Radar-derived digital elevation model grids (m). Height relative to the Australian Height Datum. • Total magnetic intensity grid (nT). • Total magnetic intensity grid with variable reduction to the pole applied (nT). • Total magnetic intensity grid with variable reduction to the pole and first vertical derivative applied (nT/m). • Dose rate concentration grid (nGy/hr). • Potassium concentration grid (%). • Thorium concentration grid (ppm). • Uranium concentration grid (ppm). • NASVD processed dose rate concentration grid (nGy/hr). • NASVD processed potassium concentration grid (%). • NASVD processed thorium concentration grid (ppm). • NASVD processed uranium concentration grid (ppm). The following point located data are available in this download: • Elevation. Height relative to the Australian Height Datum. Datum: GDA94 • Total Magnetic Intensity. Datum: GDA94 • Radiometrics. Datum: GDA94
-
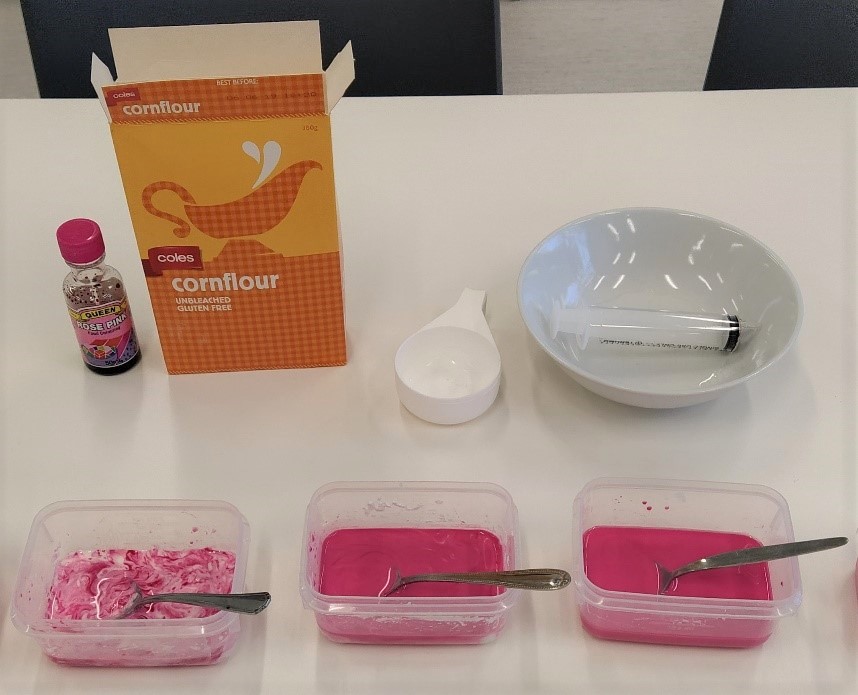
This activity introduces the concepts of lava viscosity and influence on volcanic cone shape. The download includes background information for teachers and an activity sheet for students. The activity involves making lava slime and racing this down a slope. Participants are asked to predict how lava viscosity might influence volcanic shape (a hypothesis) and then observe what does happen and relate this to the natural environment.
-
HiQGA is a general purpose software package for spatial statistical inference, geophysical forward modeling, Bayesian inference and inversion (both deterministic and probabilistic). It includes readily usable geophysical forward operators for airborne electromagnetics (AEM), controlled-source electromagnetics (CSEM) and magnetotellurics (MT). Physics-independent inversion frameworks are provided for probabilistic reversible-jump Markov chain Monte Carlo (rj-MCMC) inversions, with models parametrised by Gaussian processes (Ray and Myer, 2019), as well as deterministic inversions with an "Occam inversion" framework (Constable et al., 1987). In development software for EFTF since 2020